

 About project
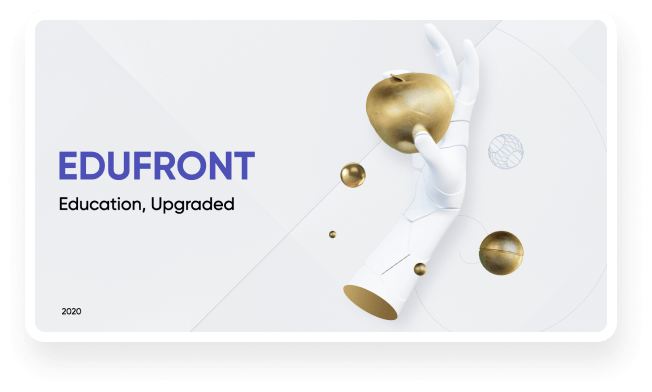
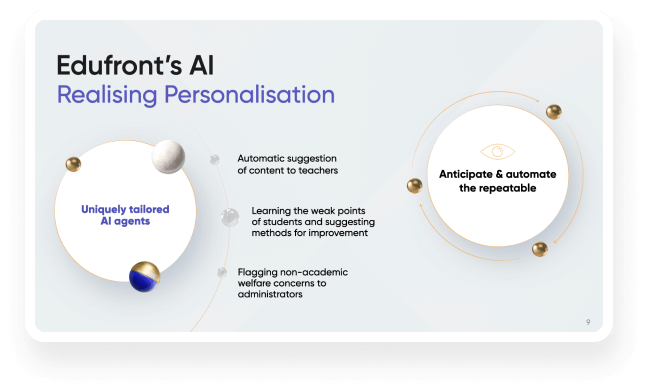
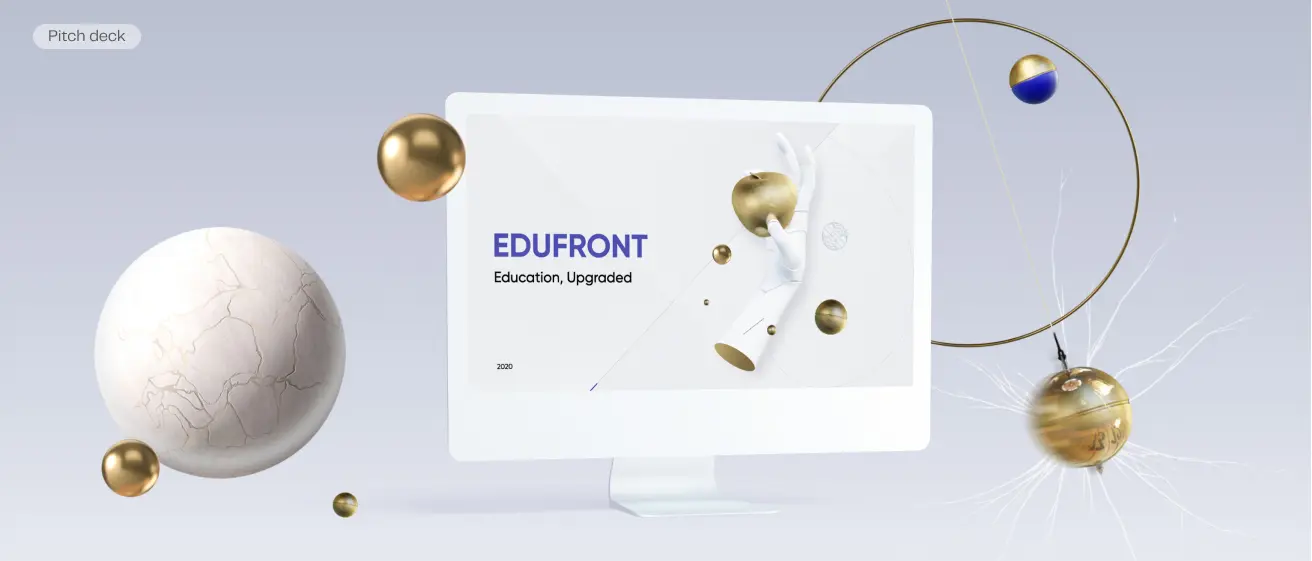
Edufront is the best software and solution platform to realising every student’s potential. We empower personalised, flexible and complete learning for schools worldwide.
 Challenge
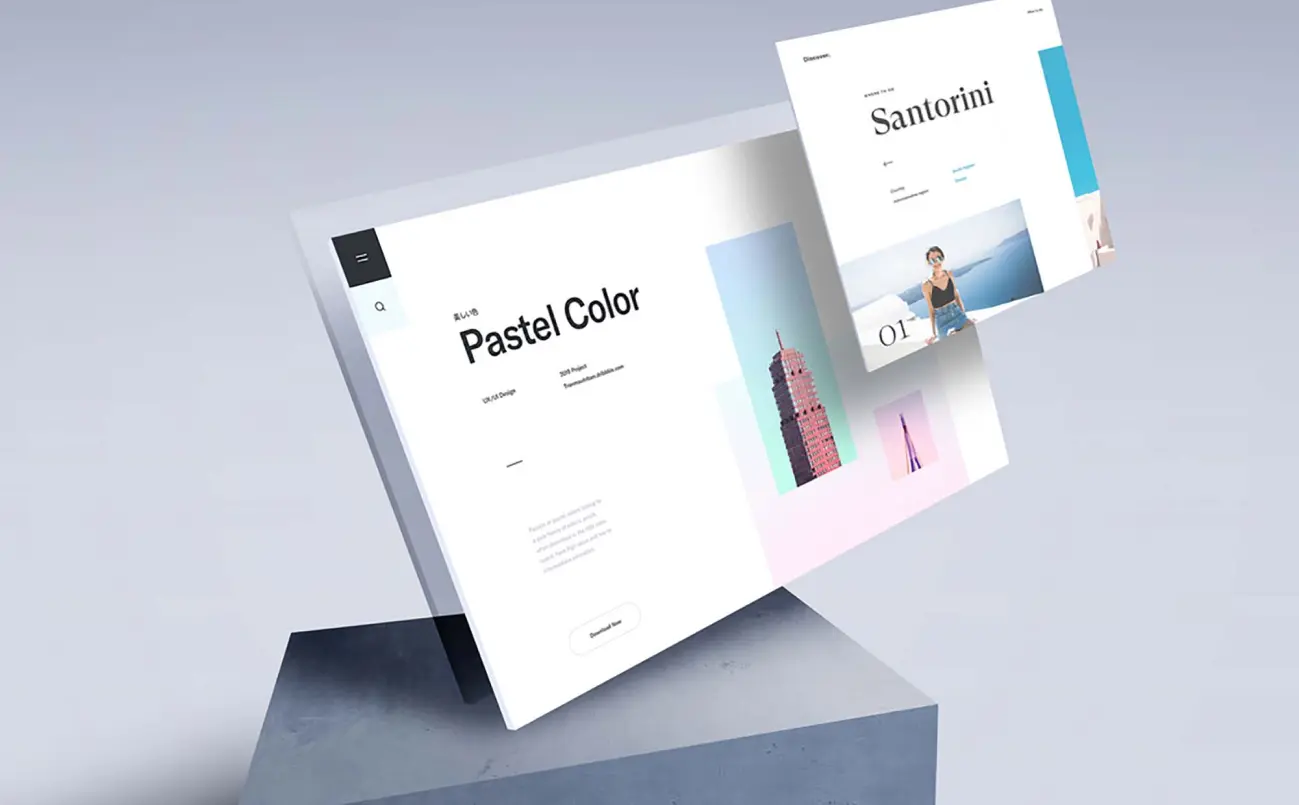
The key goal was to create the key visual and visual voice of the deck, avoiding templated and stock images that are widely used in the topic and by the competitors.